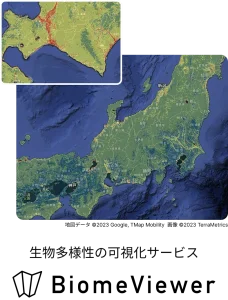
BiomeViewer
A TNFD-recognized biodiversity mapping tool

Key Features
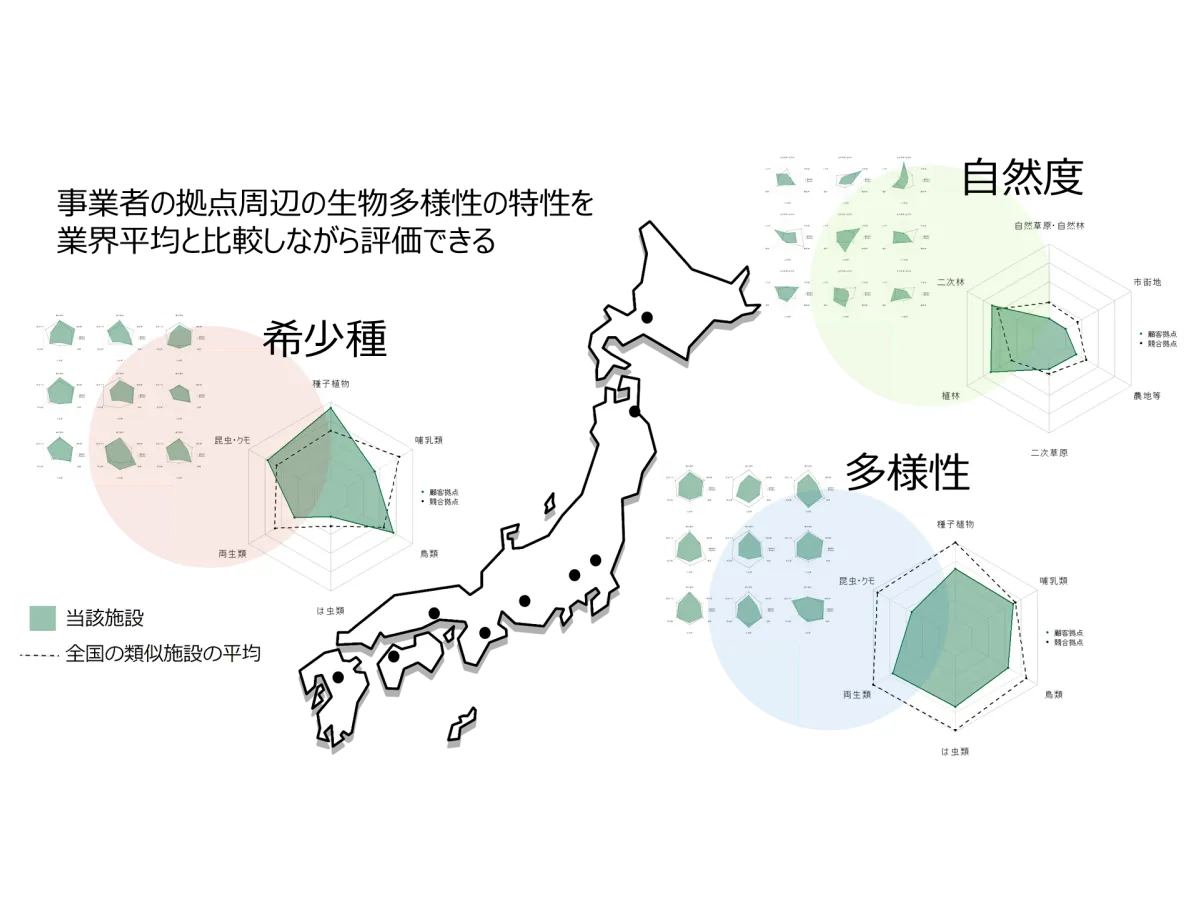
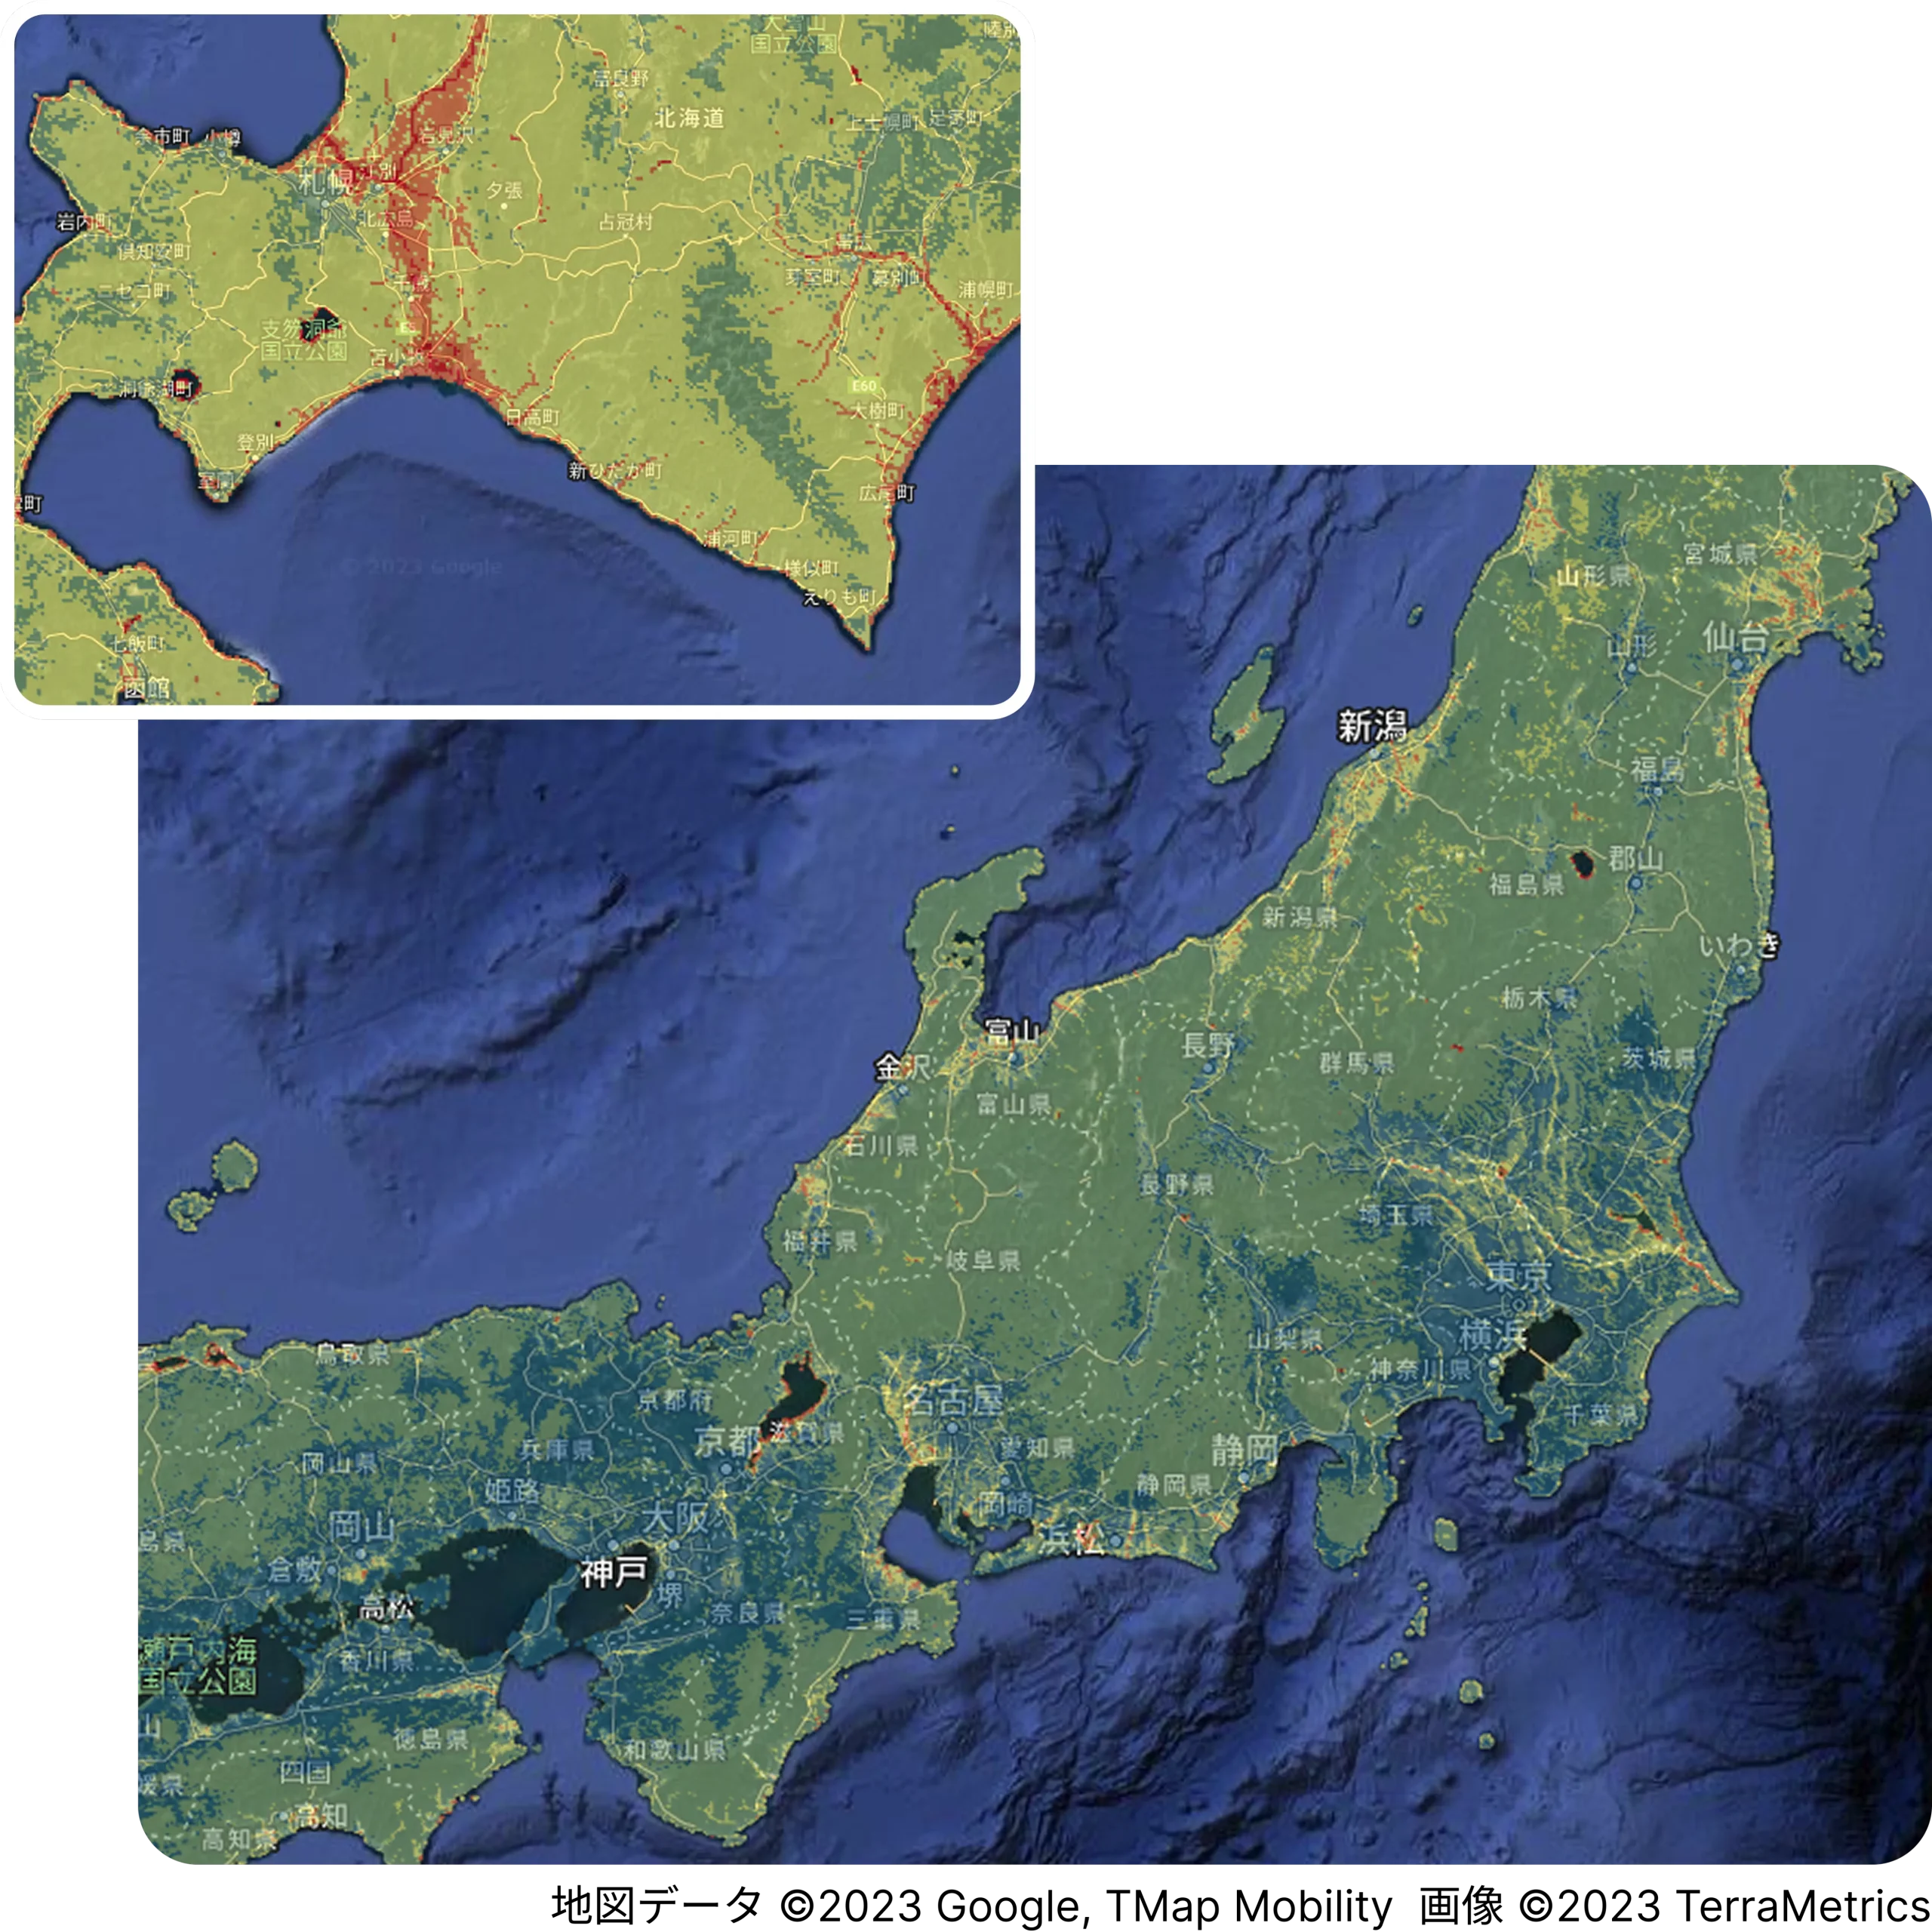
Check local species distribution at a glance. Supporting the visualization of natural capital.
Based on observation data collected from across the country, biological distribution is displayed with high precision in mesh units of less than approximately 1km².
It can be used to understand the status of natural capital around business sites, narrow down OECM candidates and certified nature-positive sites, and evaluate conservation areas.

A tool listed in the official TNFD “Tools Catalogue”
“BiomeViewer” is a visualization tool listed in the official TNFD catalogue, supporting the identification and analysis of dependencies, impacts, and risks related to biodiversity. By linking business areas with species information visualized on a map, various evaluation indicators corresponding to each operator’s materiality can be calculated.
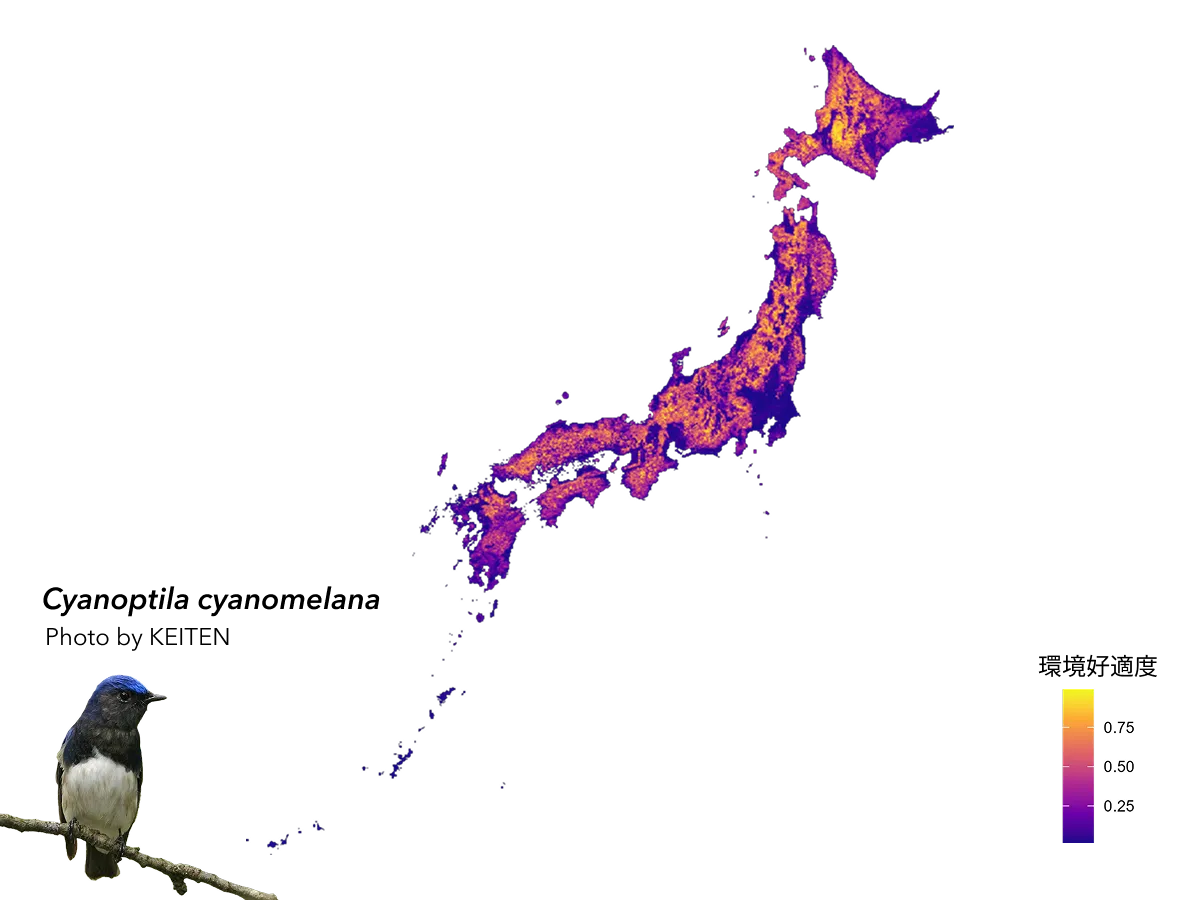
Strategically determine priority areas for natural capital using species distribution prediction maps
By utilizing Japan’s largest biodiversity big data accumulated by our company and our unique analytical methods, we can output high-precision distribution prediction maps for each target species. For example, by combining environmental indicator species with species that provide cultural services, unique indicators tailored to the evaluation purpose can be visualized on a map. This enables the strategic identification of priority areas for natural capital and their application to business and conservation measures.
Case Studies Using This Product
Related Services






Keywords
All Products